HMI Group
Wolf-Achim Kahl
Impressum
| Home |
Vita |
Publications |
Research |
3D quantitative image analysis of X-ray µ-CT-derived volume data
In the past decade I focused my research on the microstructural evolution of fluid rock systems by 3D quantitative image
analysis of µ-CT-derived volume data. My research approach is based on true-3D microfabric analyses, in combination
either with observations in natural rocks or experimental simulations of fluid-rock systems and concomitant microanalytical
surveillance of the reaction progress. |
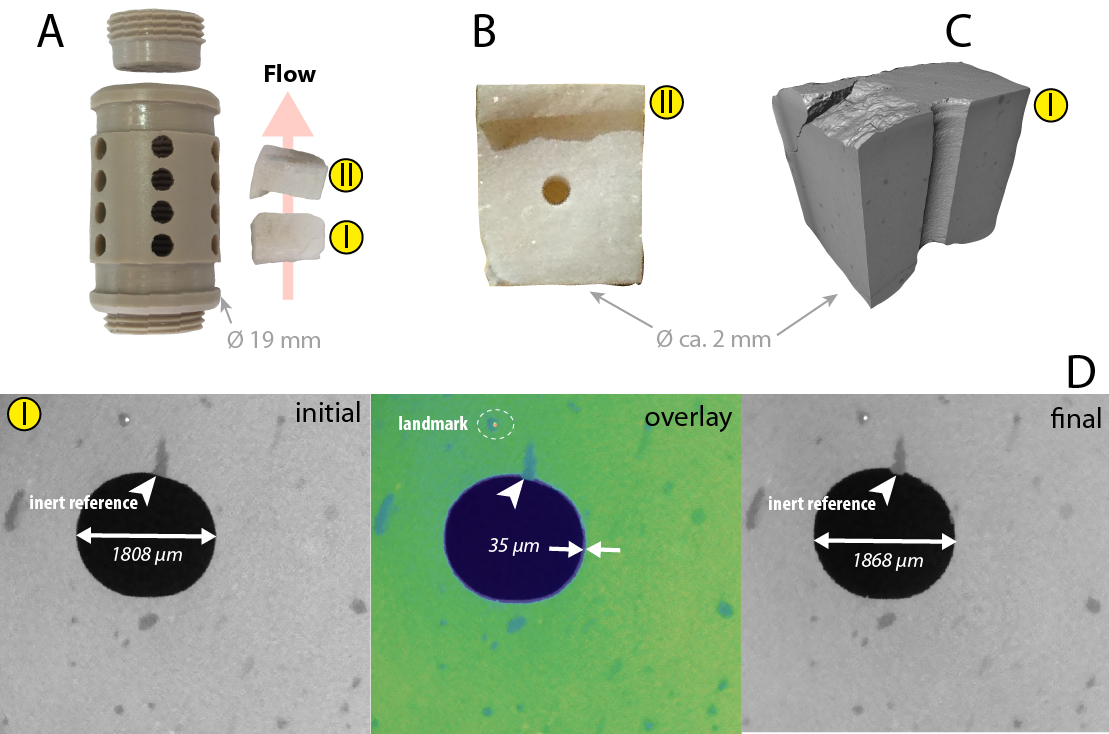
Crystal surface reactivity analysis of marble in a perforated PEEK chamber within the flow cell in a flow-through experiment |
|
Visualization of (A) the perforated PEEK chamber for sample assembly in a flow-through experiment with marble; (B) bottom-view of sample; (C) section through volume reconstruction. Image sequence of a single reconstructed slice (D) visualizes the surface retreat (overlay) of calcite by comparison of the unreacted (top: initial) vs. reacted (bottom: final) state of the experiment. The view is down the central hole of the sample. Figure is modified after: Kahl et al. (2020) Crystal surface reactivity analysis using a combined approach of X-ray micro-computed tomography and vertical scanning interferometry. American Journal of Science 320(1), 27-52. doi: 10.2475/01.2020.03 |
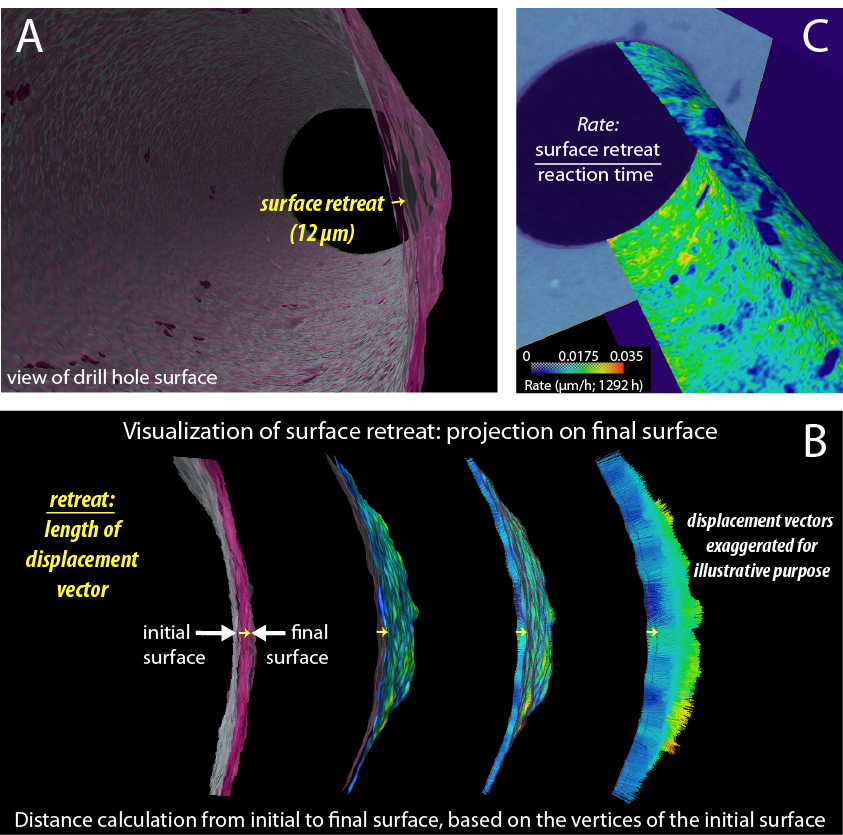
Quantitative 3-D digital image analysis to determine reaction progress by a X-ray µ-CT survey |
|
Determination of surface retreat and rate map calculations from µ-CT volume data. (A) Material loss in the course of the flow-through experiment; (B) Principle of distance measures between initial and final mineral surface; (C) The conversion of a surface distance map into a rate map (µm/h) is achieved by division of surface retreat by reaction time. Figure is modified after: Kahl et al. (2020) Crystal surface reactivity analysis using a combined approach of X-ray micro-computed tomography and vertical scanning interferometry. American Journal of Science 320(1), 27-52. doi: 10.2475/01.2020.03 |
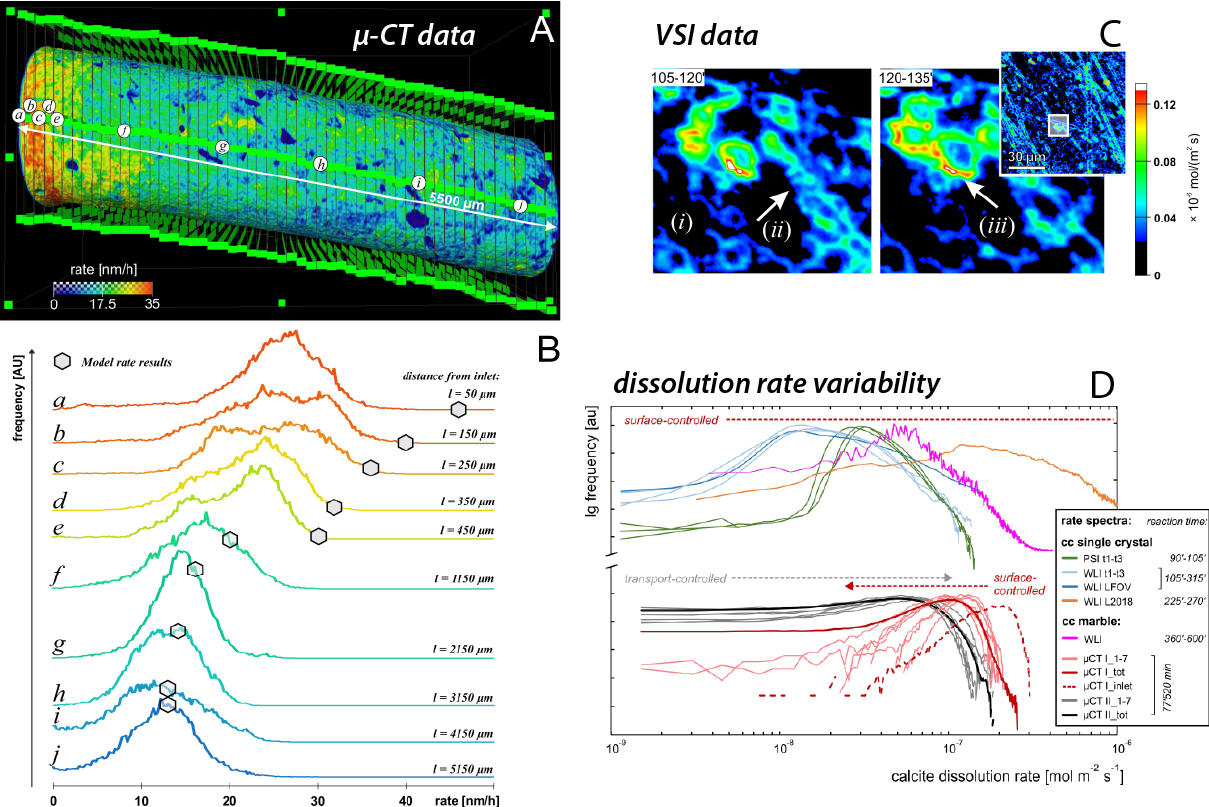
Crystal surface reactivity analysis using a combined approach of X-ray micro-computed tomography (µ-CT) and vertical scanning interferometry (VSI) |
|
Characterization of the dissolution rate variability covering the nm- to mm-scale of dissolving single-crystal and polycrystalline calcite samples. (A) µ-CT-derived ratemap after 54 days of percolation experiment; (B) Spatial variability of the frequency distribution of dissolution rates derived from a µ-CT survey covering 5.5 mm of marble surface; (C) Spatial variability of the frequency distribution of dissolution rates in a VSI experiment; (D) Compilation of calcite single-crystal and polycrystalline calcite dissolution rate variability from µ-CT and VSI observations. Figure is modified after: Kahl et al. (2020) doi: 10.2475/01.2020.03 |
Combination of experimental simulation and µ-CT survey |
|
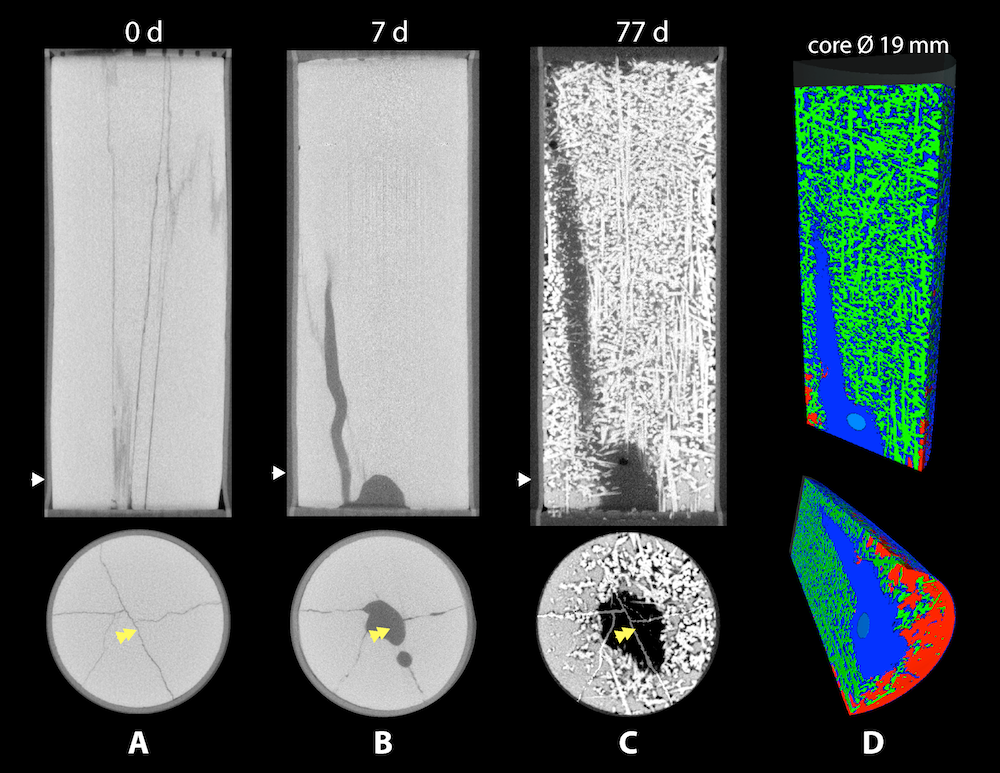
4-D series of the conversion from gypsum to anhydrite (77 days at 110 °C, fluid pressure 45 bar (4.5 MPa) with gypsum-saturated fluid).
In the course of the experiment, the gypsum single crystal (artificially fissured for fluid permeability) has almost completely converted
to acicular anhydrite. A 3D model of the final stage shows the last remains of gypsum near flow-in. Figure taken from: Kahl, W.-A., Hansen, C., Bach, W. (2016) A new X-ray-transparent flow-through reaction cell for a µ-CT-based concomitant surveillance of the reaction progress of hydrothermal mineral–fluid interactions. Solid Earth 7, 651-658. doi:10.5194/se-7-651-2016 |
Development of a new X-ray-transparent flow-through reaction cell for a µ-CT-based concomitant surveillance of the reaction progress of hydrothermal mineral–fluid interactions |
|
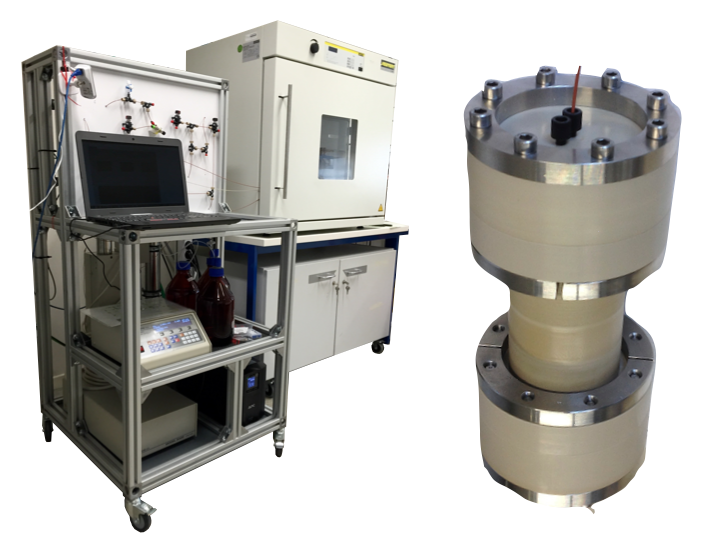
A new flow-through reaction cell consisting of an X-ray-transparent semicrystalline thermoplastic has been developed
for percolation experiments. Core holder, tubing and all confining parts are constructed using PEEK (polyetheretherketone)
to allow concomitant surveillance of the reaction progress by X-ray microtomography (µ-CT).
On the left: photograph of an ongoing percolation experiment: the percolation cell is located inside the oven,
recharge- and discharge fluids are connected by PEEK capillary tubing.
The pump system, recharge- and discharge fluid storage, and the board with the flow line are
installed on a mobile rack. To facilitate the transfer of the percolation experiment from
the oven laboratory to the X-ray microtomography laboratory for scanning,
the mobile rack is equipped with an uninterruptible power supply; On the right: photograph of the assembled cell,
with PEEK tubing 1/1600 (1.60 mm) O.D. attached. Figure is modified after: Kahl et al., (2016) doi:10.5194/se-7-651-2016 |
3-D microstructure of olivine in deserpentinized ultramafic rocks reconstructed by correlative X-ray µ-CT and electron backscatter diffraction (EBSD) analyses |
|
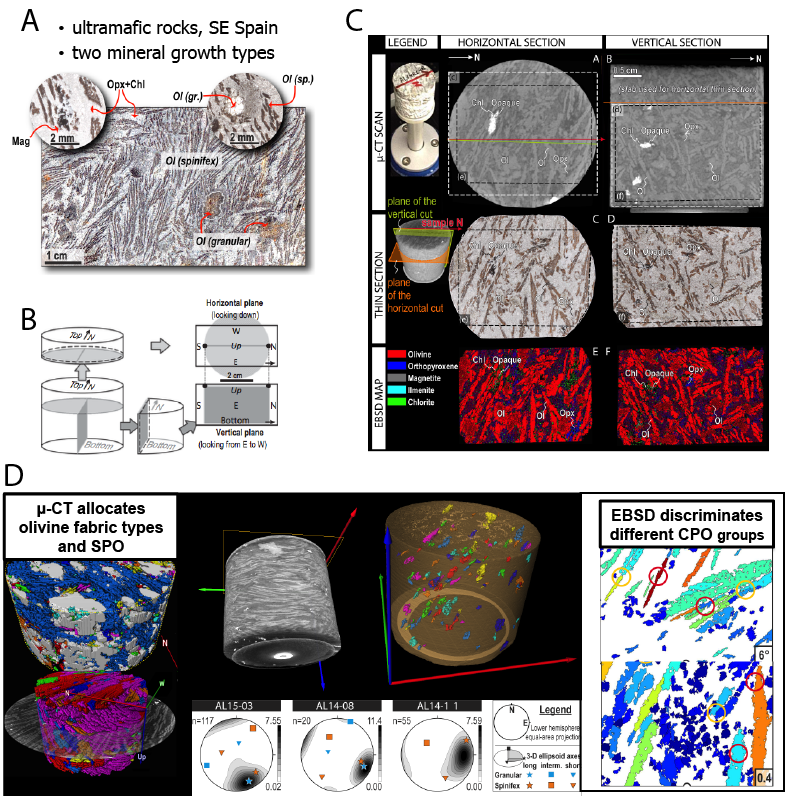
Correlative µ-CT- and EBSD analyses of the 3-D microstructure of olivine. (A) Granular and spinifex olivine form as two different mineral growth types upon dehydration of serpentinite; (B) Semi-destructive approach of correlative µ-CT- and EBSD analyses; (C) Correlation of µ-CT and EBSD data to facilitate proper correlation of orientation information; (D) Characterisation of olivine microfabric and shape by µ-CT, and crystal orientations by EBSD. Figure is modified after: Kahl, W.-A., Dilissen, N., Hidas, K., Garrido, C. J., López-Sánchez-Vizcaíno, V. and Román-Alpiste, M. J. (2017): 3-D microstructure of olivine in complex geological materials reconstructed by correlative X-ray µ-CT and EBSD analyses. Journal of Microscopy 268, 193-207. doi:10.1111/jmi.12598 |
Characterisation of the 3-D microstructure of olivine as primary reaction product of deserpentinisation by digital image analysis |
|
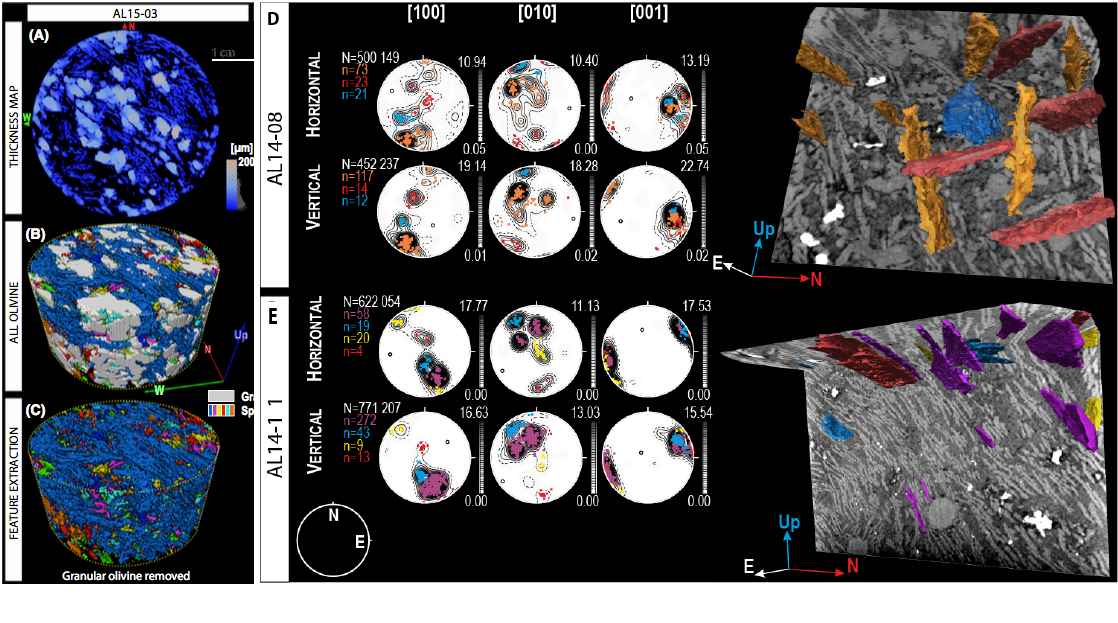
Digital image analysis to characterise the microstructure of granofels and spinifex olivine by combined shape and crystallographic orientation. (A) Local thickness map (i.e. a colour-coded representation of the structural thickness) of one slice of the data volume; (B) 3-D models of granular (rendered white) and spinifex olivine; (C) Visualisation of feature extraction by removing the granular olivine crystals; (D,E) Characterisation of the microstructure of spinifex olivine by combined shape and crystallographic orientation in samples AL14-08 (D) and AL14-11 (E). Figure is modified after: Kahl et al. (2017) doi:10.1111/jmi.12598 |
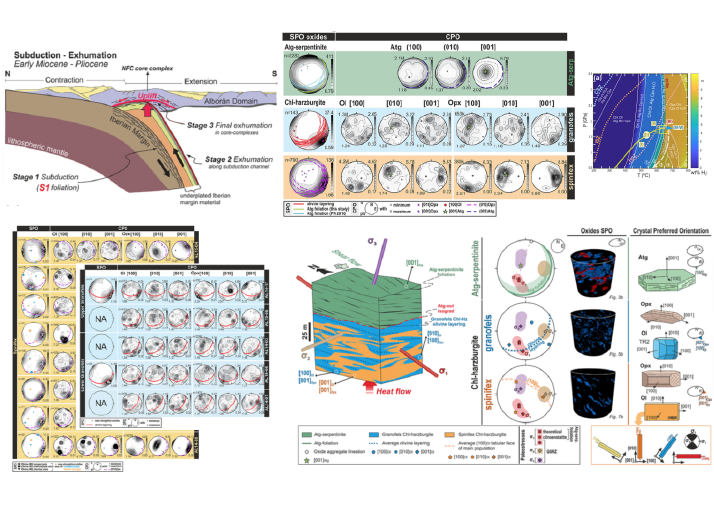
Textural evolution during high-pressure dehydration of serpentinite to peridotite and its relation to stress orientations and kinematics of subducting slabs |
|
The correlative X-ray micro-computed tomography (µ-CT) and Electron Backscatter Diffraction (EBSD) study of oriented samples across the
Atg-serpentinite dehydration isograd of the Almirez massif provides a detailed account of the textural evolution during high-P serpentinite dehydration
to peridotite. Crystallization of granofels and spinifex Chl-harzburgite records, respectively, a sequence of slow and fast fluid draining events
during serpentinite dehydration under the same orientation of the principal stresses that resulted in the Atg-serpentinite shear deformation.
The ESE-WNW oxide aggregate lineation of spinifex and granofels Chl-harzburgites and the [001]Ol platelet lineation of the spinifex
tabular olivines subparallel to σ2 could mark the along strike paleoflow direction of fluids below the Atg-out dehydration front.
Figure is modified after: Dilissen, N., Hidas, K., Garrido, C. J., Kahl, W.-A., Sánchez-Vizcaíno, V. C., Padrón-Navarta, J. A. (2018) Textural evolution during high-pressure dehydration of serpentinite to peridotite and its relation to stress orientations and kinematics of subducting slabs: Insights from the Almirez ultramafic massif. Lithos, 320-321, 470-489. doi: 10.1016/j.lithos.2018.09.033 |